Chart Your Growth with Analytics
SimpleTexting allows you to track your campaign performance with our built-in analytics tools. At a glance, you can see how many new subscribers you’ve gained, the number of users clicking links in your texts, and the number of messages sent per list. With data like this, you can tweak your campaigns for optimum performance.
You also have to option to download a detailed report for any campaign you send. Each report details the first names, last names, phone numbers, and delivery statuses of every message sent within the campaign.
Watch How You Perform
To view your analytics, log in to SimpleTexting and click the Analytics tab on the left-hand side of the menu. The available reports are divided into three tabs: Subscribers report, Campaigns report, and Billing stats.
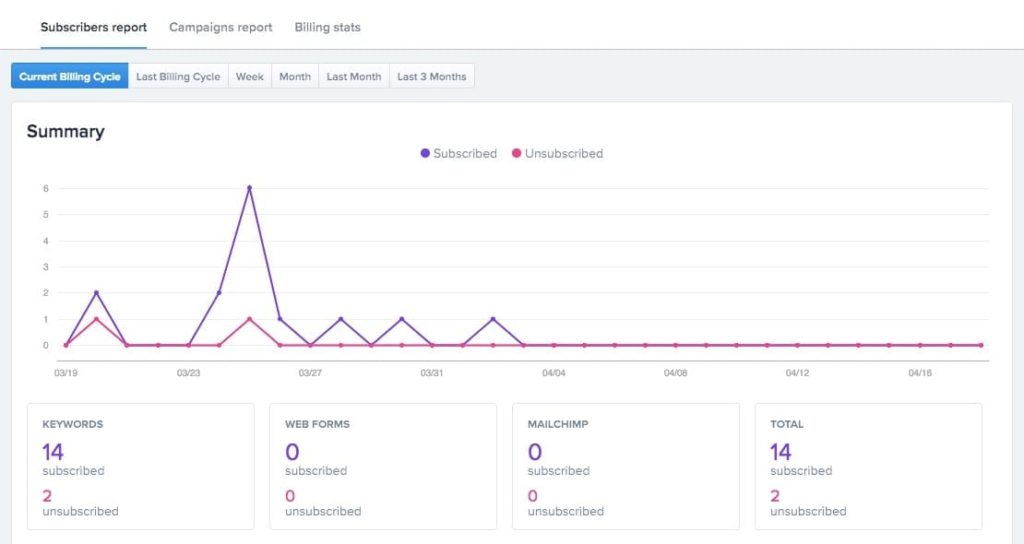
1. Learn Where Your Subscribers Come From
In your Subscribers report, you can see how many people have subscribed and unsubscribed from your list based on how they joined—keyword, web sign-up form, etc.
👀 Watch for changes in the unsubscribe rate to see how your messages are being received by your customers.
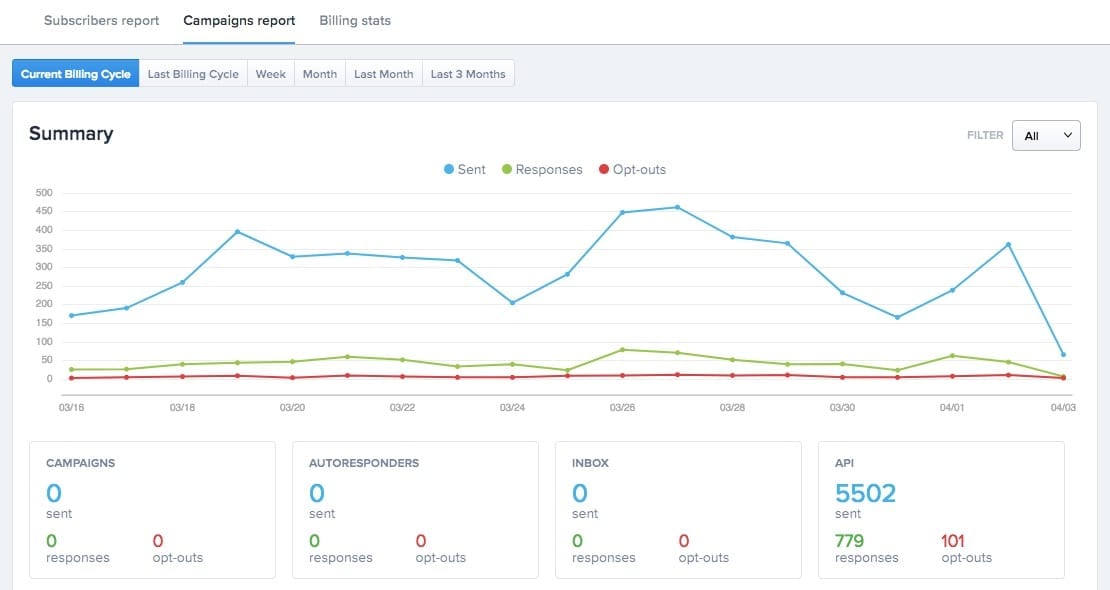
2. Monitor How Subscribers Are Responding
In the Campaigns report, you can view how many text messages you’ve sent and received, plus additional information like opt-outs and clicks.
👀 Watch to make sure message volume is consistent. Peaks in activity can annoy subscribers, and customers sometimes forget about their subscription during troughs.
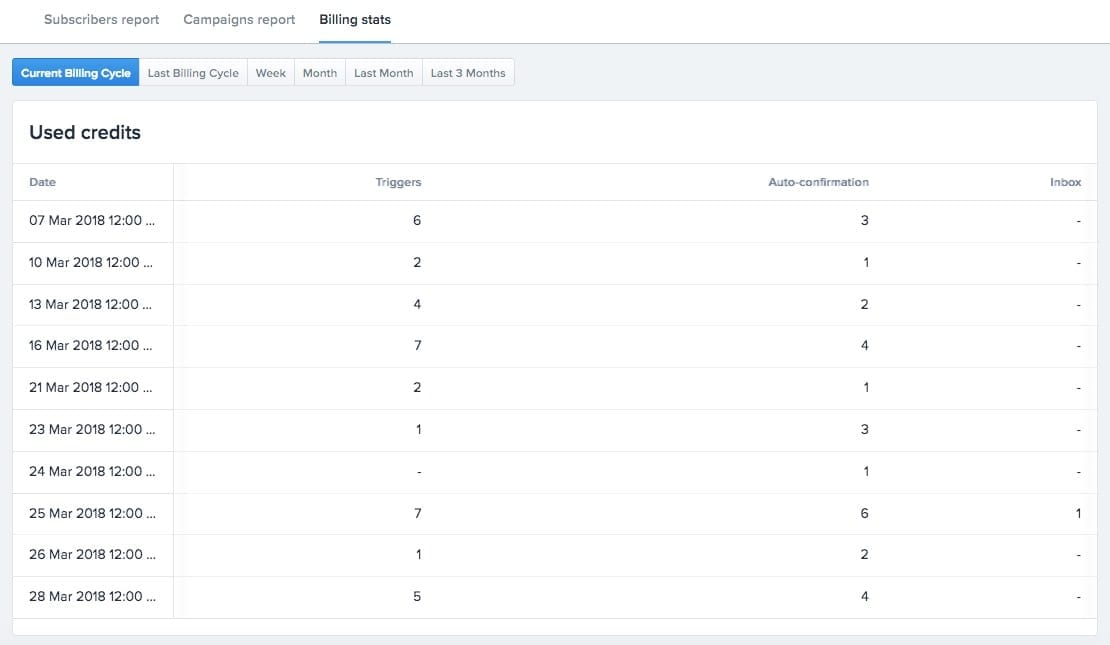
3. See Where You Spend The Most Credits
In Billing stats, you can see a snapshot of how and when your credits are being spent on text messaging.
👀 Watch for any overage fees. If you’re consistently sending more messages than your plan provides you may want to consider scaling up.
Find Out How Engaging Your Content Is
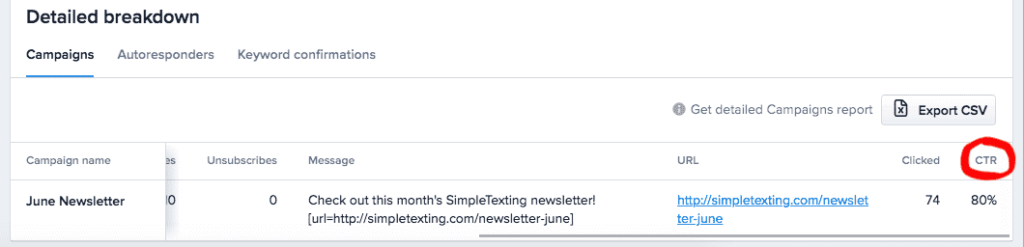
When you use our link shortener you have the ability to track the click-through rate of your message.
Your CTR can give you a clear indication of whether or not the content you’re delivering is relevant to your audience, among other things.
To view your CTR for any given campaign, open your Analytics tab and scroll to the bottom of the page where you’ll see a grid with all your campaigns.
For every campaign where a shortened link was sent, you can scroll all the way to the right to see a column labeled CTR. Below, is your click-through percentage for that campaign.
From here, you have the option to segment your audience based on their click behavior.
Create a text that sends automatically after a subscriber clicks a link in a specific message, and send another to those who didn’t click. Step-by-step instructions for this are available on our help center.
Get The Inside Scoop On Your Campaigns
If you’re curious who unsubscribed from your last campaign. your detailed delivery report will have the answer.
To download your report you’ll need to:
1. Go to Campaigns in the sidebar and select the one you’re interested in.
2. At the bottom of your campaign summary, click the Export button.
3. Open the CSV file. It should look something like this:
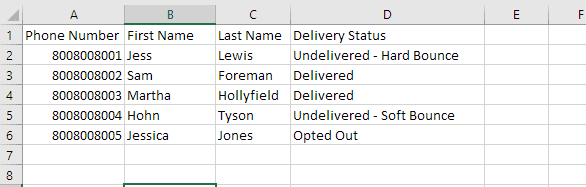
The delivery statuses in your report include:
Delivered: The message was successfully delivered to the recipient
Opted-out: The recipient unsubscribed after receiving this campaign
Undelivered – Soft Bounce: The message wasn’t delivered yet but the number is active, so the message may be delivered later on. The phone may have been off or away from cell coverage.
Undelivered – Hard Bounce: The message wasn’t delivered and the number has been marked as invalid. It may be a landline or another number incapable of receiving texts. Once a number has been marked as invalid, we won’t try to deliver messages to it in the future.