Since its release in fall 2018, Apple’s screen time tracking system has provided fascinating insights into how Americans use their smartphones. So, what does screen time in the U.S. look like? We compiled 2,000+ users’ screen time data below to find out.
In 2019, we rely on our smartphones for just about everything. We have apps to ensure we never get lost, can keep up with our friends’ latest tropical vacation, and be plugged into our email whenever we desire. In September 2018, Apple’s iOS 12 update provided us iPhone users with a new tool – the ability to track and be updated on our screen time usage.
This tracking system funneled new data toward popular attention on what iPhone usage actually looks like for Americans. In addition to screen time, the chart in the Settings app also lists out the number of notifications, the number of times a phone is picked up or unlocked, the amount of time spent on social apps, and other data points associated with usage. This screen time check-in can be eye-opening. A few minutes here and there spent checking in on apps doesn’t necessarily feel like that much time, but it can actually total up to a lot of time.
In order to get a more clear picture of how much time Americans spend on their phones each day, we recently conducted a survey on screen time habits. We asked 2,103 survey respondents to open the screen time portion of the Settings app and report data points including their daily screen time in minutes and their most-used apps.
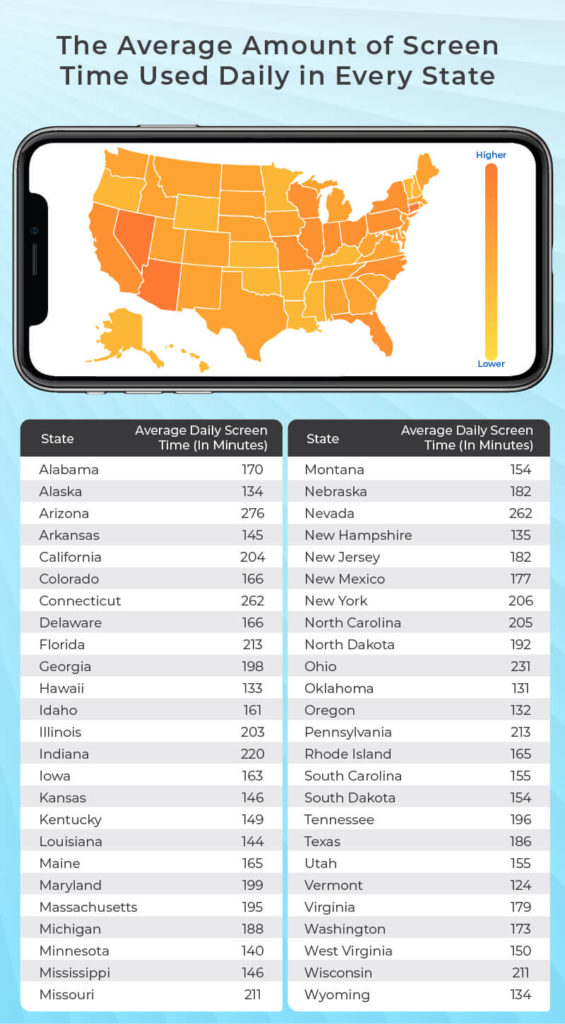
The Average Amount of Screen Time Used Daily in Every State
First, our survey asked about daily screen time, and broke down the results by state. The Southwestern United States, as it turns out, is a hotbed for smartphone usage. Two out of the three states with the highest screen time are located there – Nevada (262 minutes), Arizona (276 minutes), and Connecticut (262 minutes). We were fascinated to find that the average amount of daily screen time for every state in the country is over 2 hours long, and as a whole country, Americans spend an average of 177.62 minutes, or almost 3 hours, on their phone a day. Residents of the state with the highest average screen time, Arizona, use their phone for almost 5 hours a day. And the state with the lowest average daily screen time? Oklahoma (131 minutes), followed by Oregon (132 minutes), and Wyoming (134 minutes).
The Average Amount of Screen Time Used Weekly in Every State
Our team also wanted to see what screen time usage looked like on a weekly basis. We used each state’s daily average to calculate their projected weekly average. According to our projections, Arizona residents spend an average of 32.2 hours on their phone a week. Compare that to the state with the lowest screen time, Oklahoma, whose residents spend on average less than half of that time on their phone per week (15.28 hours). As a whole, Americans spend an average of 20 hours a week on their phones.
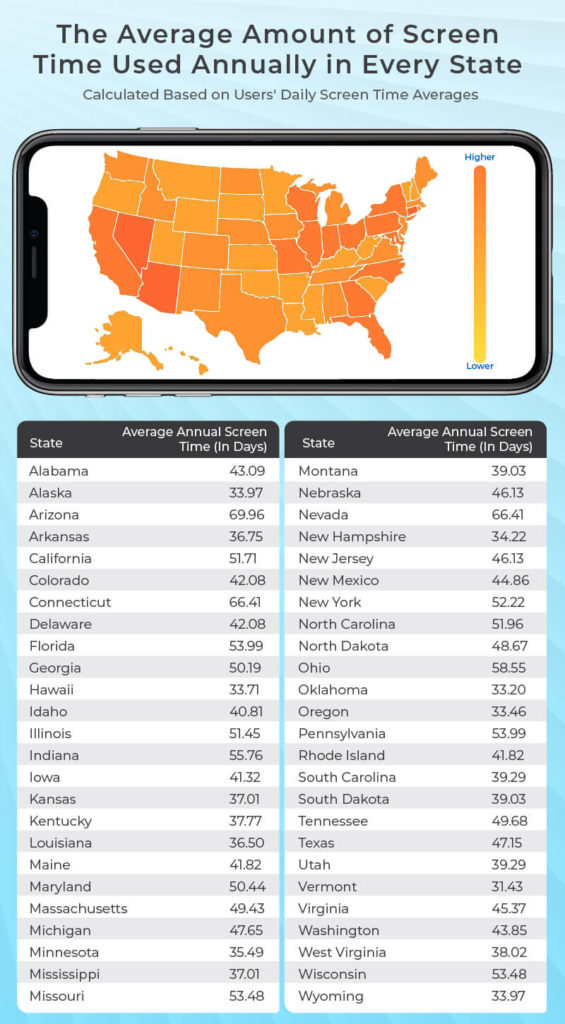
The Average Amount of Screen Time Used Annually in Every State
Considering the way we spend our time projected out over the course of a year can be really impactful. To demonstrate this, we use the daily screen time average for each state to calculate the amount of time in days that people would spend on their phones over the course of the year. The results are staggering. Americans across the United States spend an average of 45 days on their phone. Read through the above graphic to see the annual screen time breakdown state-by-state.
Comparing the Screen Time Habits of Baby Boomers, Gen Xers, and Millennials
Of course, technology adoption depends upon more than just location. Another factor we explored was the difference in screen time among generations in our respondents. Perhaps unsurprisingly, Millennials use their phone the most across the board. The average daily screen time for Millennials is 205 minutes; for Gen Xers, 169 minutes; and for Baby Boomers, 136 minutes. While the difference between generations is significant per day, each generation spends over a month on their phone per year.
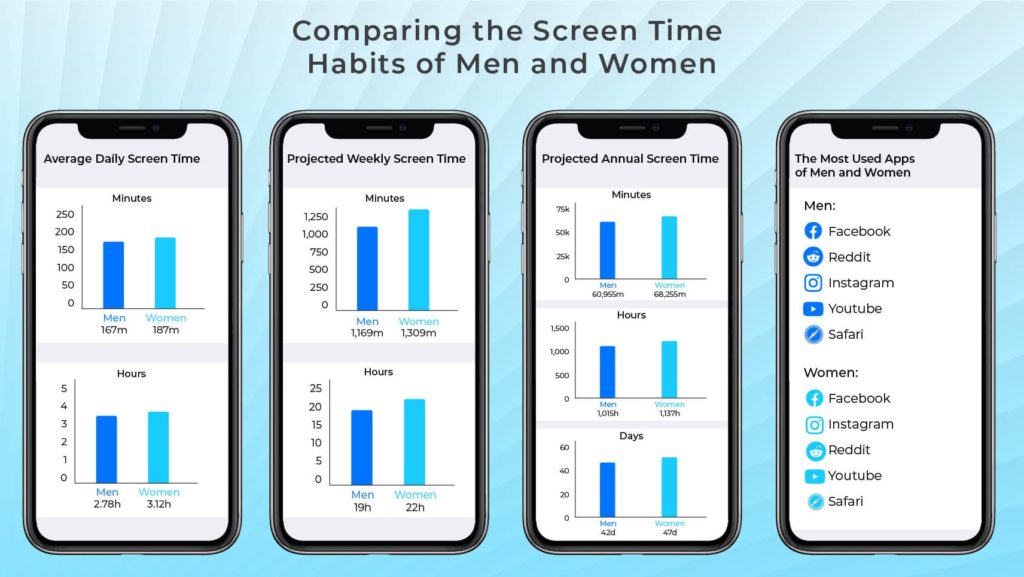
Finally, our survey broke down the screen time habits of men and women to identify the differences. Our results showed that while women have a longer average screen time (187 minutes) than men (167 minutes), they shared the same most-used apps, albeit in different orders: Facebook, YouTube, Reddit, Instagram, and Safari.
It’s no secret that Americans love their smartphones. This data proves that in many places, they’re glued to them. When considering the amount of time that many people spend on their phones, we here at Simple Texting urge you to consider the importance of including SMS marketing into your overall customer relationship and marketing strategy.
Alfredo Salkeld
Alfredo is SimpleTexting's brand manager. He's passionate about using his 10+ years of marketing experience to help small businesses grow.
We surveyed 1,000 consumers and 400 SMS marketers to uncover hot topics that we all need to know - including consumer behaviors, marketing ROI, and the impact of AI on business texting.
Start a text marketing campaign or have a 1-on-1 conversation today. It's risk free. Sign up for a free 14-day trial today to see SimpleTexting in action.
Hey! Looks like you're browsing from outside of North America.
Just so you know, SimpleTexting helps businesses in US & Canada only. If you are looking to send internationally or are based elsewhere in the world, you will love our sister product Sinch Engage.