COVID-19 profoundly changed how we use technology. We surveyed Americans to learn more about screen times post-pandemic and our findings might surprise you!
Technology is as pervasive as ever these days. It’s in every room of our homes, and quite often either in our pockets or on the table in front of us. We ran a survey of over 3,000 Americans to gauge the average screen time of individuals in a variety of states across the US. We asked individuals about their habits and opinions regarding the time we spend on our phones each day. What’s more, we asked them to break into their Apple screen time summary to report their daily screen time in minutes, which we then converted into hours, and days.
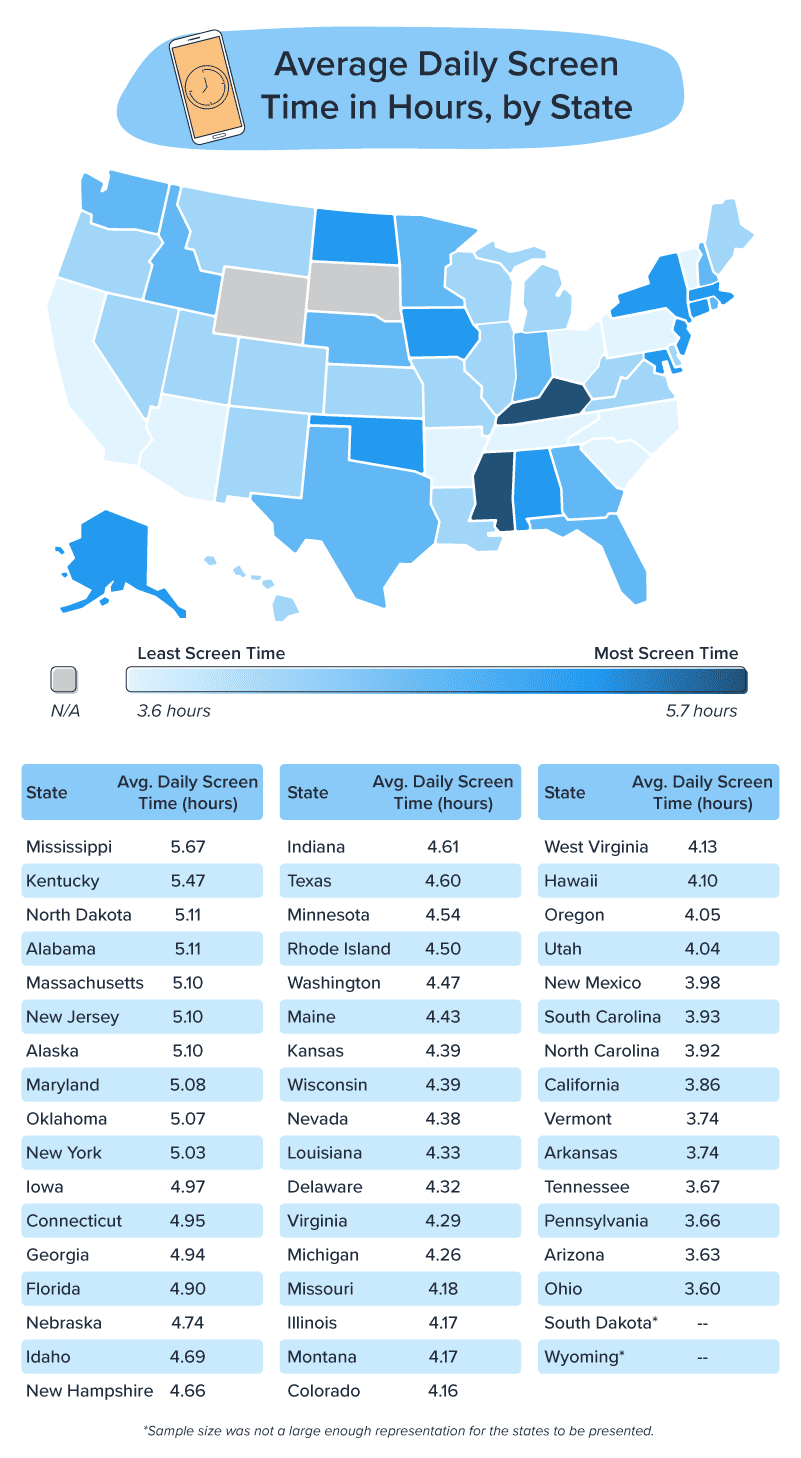
Read on to find the average daily and annual screen time in your state!
Coming in at #1 for screen time in 2021 was Mississippi, at an average of 5.7 hours a day on their phones, with Kentucky close behind.
An unexpected outcome of this survey overall was that our West Coast respondents are on their phones less each day than our East Coast ones – an odd finding considering California is known as an influencer hub, a profession associated with a considerable amount of time spent on a phone. New York, however, was found to surpass California’s screen time by an hour. Maybe it’s CA’s sunny weather that keeps people off their phones.
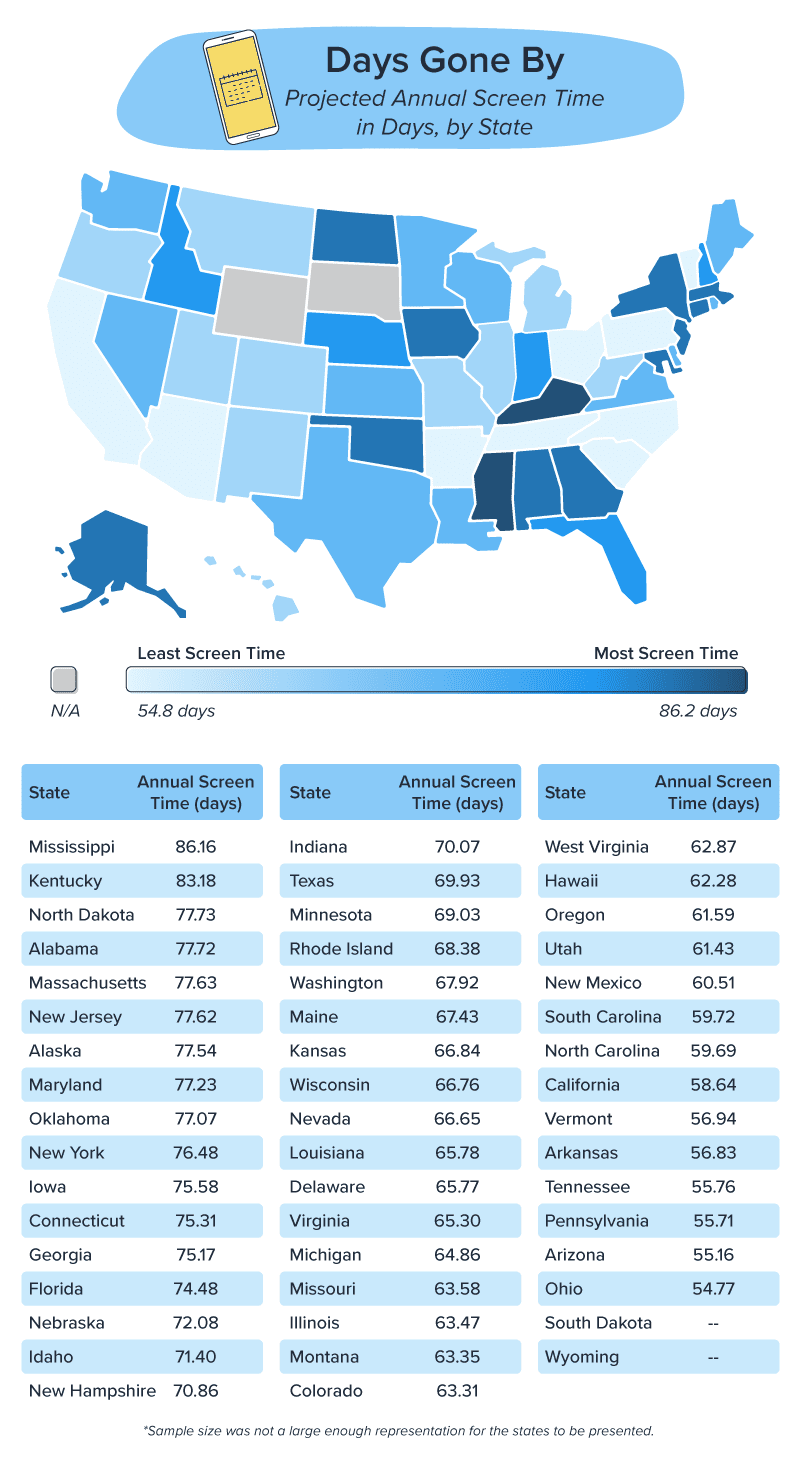
When you do the math, Mississippians will spend an average of 86.2 days worth of time on their phones this year. That’s 40 hours a week on their phones – as much as a full time job.
To put these numbers in perspective, Mississippians could watch every episode of:
Law and Order: SVU
Grey’s Anatomy
The Simpsons
Criminal Minds
The Walking Dead
Friends
The Office (US)
Seinfeld
Every movie in the Marvel Cinematic Universe
All the extended Lord of the Rings and Hobbit movies,
And still have 30 hours left to do as they please.
It’s no secret that the COVID-19 pandemic has altered our screen time, but more surprisingly perhaps, screen time actually went down in a few states.
Ohio and Arizona followed this trend, with Arizona’s average screen time dropping significantly from 2019. While we can’t be entirely sure what drove this change, it is a fact that Arizona provides gorgeous natural landscapes for its residents to enjoy, allowing them ample opportunity to step away from their phones.
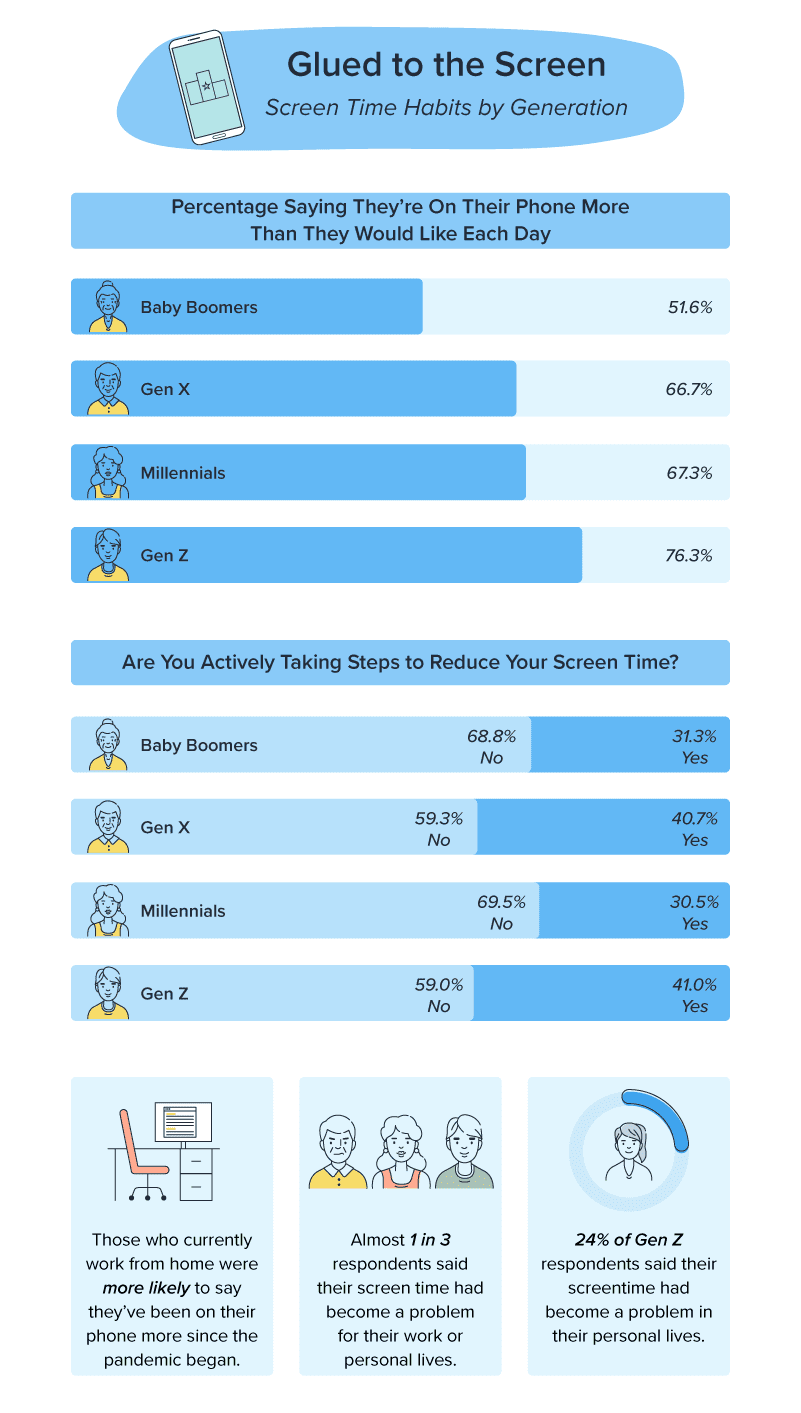
It seems that we’re all aware of how much time we spend on our phones. Over half of respondents from every generation admit to being on their phone more than they’d like, but only two generations say they are actively taking steps to reduce their screentime. Removing their phone from their bedroom or having set time away from their phone, were two strategies these groups use. These strategies may seem obvious, but the two generations using them may surprise you.
Gen X (aged 41-56) and Gen Z (aged 6-24) were the most likely to take steps to reduce their screen time. Gen X, besides Baby Boomers (aged 57-75), are the generation most likely to remember growing up in a time where tech wasn’t nearly as pervasive as it is now. This may be a driving factor in their interest to reduce their reliance on technology.
More curious is why Gen Z was more likely than their millennial predecessors to take steps to reduce their screen time. Being known as the generation of digital natives, perhaps they want to experience a life less plugged in than the one they’ve known for so long? It could also be a factor that 24% of Gen Z respondents report that their screen time has become a problem in their personal lives; an issue that may just be motivating enough to put the phones down.
Social media has been heralded as both the best and the worst thing to happen in recent decades.
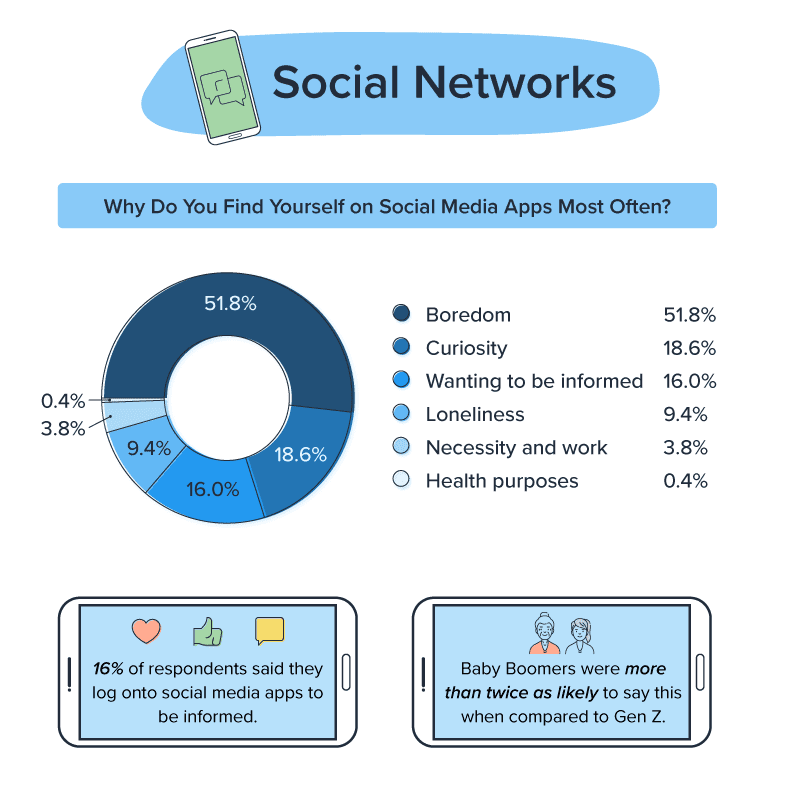
While many cite the ability to keep in touch with loved ones who live farther away as a reason they use social media, boredom prevails as the main reason over half of respondents scroll social media apps.
Interestingly enough, 16% of respondents also say the main reason they log onto social media apps was to be informed, with Baby Boomers being more than twice as likely to cite this reason than their Gen Z counterparts. With technology on our person at all times, it makes sense that some would want to log on to inform themselves. Many would prefer to do so by seeing social media posts about recent events from friends and family, rather than wait for the local news to air.
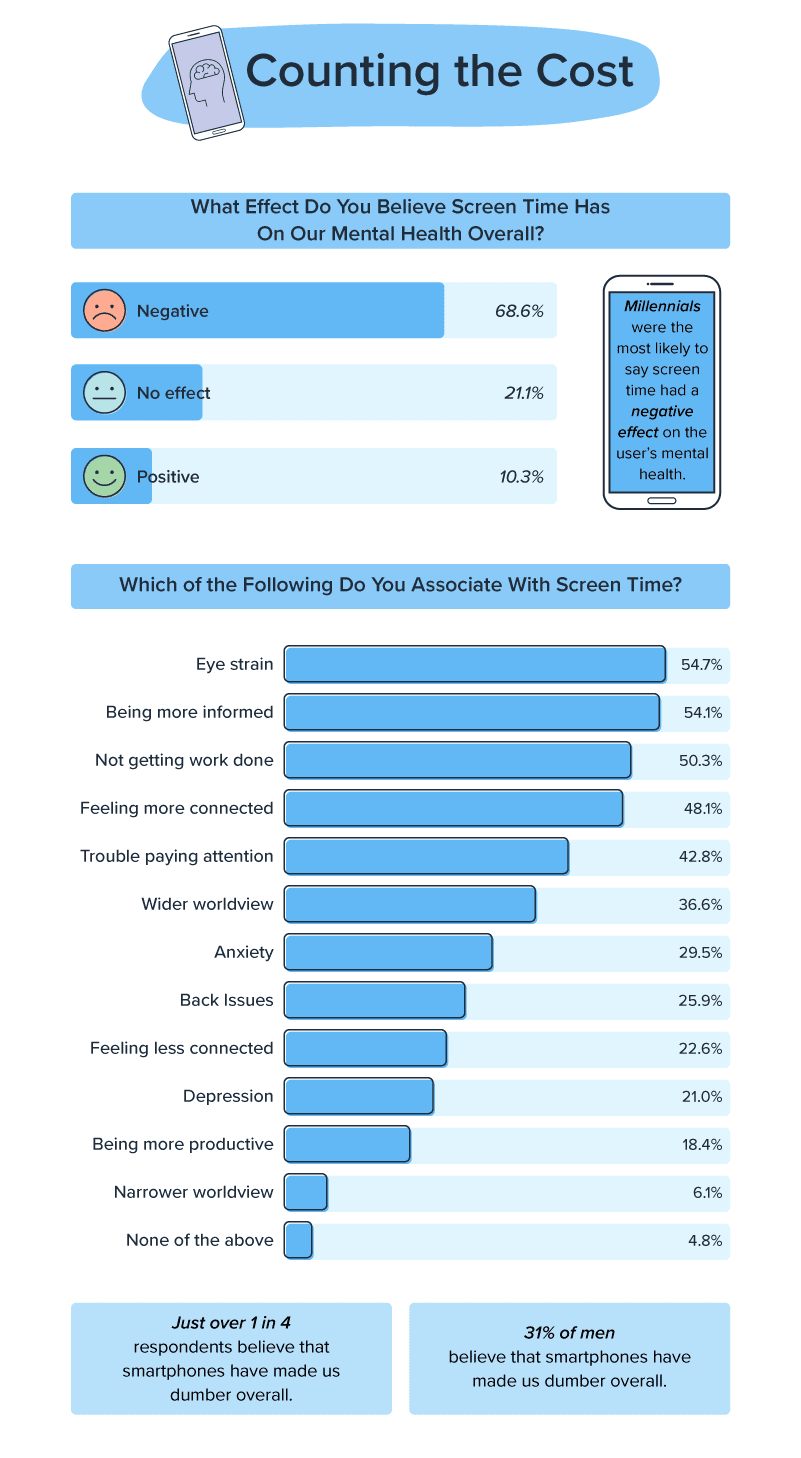
A hot conversation in recent years is the effect that social media has on our mental health, especially that of teens and children. Almost 69% of respondents overall believe that social media has a negative effect on our mental health, with millennials leading that charge.
Many people believe social media is also responsible for a range of negative side effects including eye strain and a lack of productivity. In fact, just over 1 in 4 respondents believe that smartphones have made us less intelligent overall, which leads to the question: How do we strike a balance so that we don’t allow these devices to do us more harm than good?
Final Thoughts
One thing we can be sure of is that smartphones aren’t going away. And the good news is that the impact of smartphones is not all bad. This technology has obvious benefits, but it’s how we use it that determines the effect it has on our lives. SimpleTexting is a service that helps us better utilize our phones. Get started with our ultimate guide to SMS marketing and a 14-day free trial of SimpleTexting to get in front of your audience where they already are – on their smartphones.
Methodology and Limitations
To gain the data presented in the above study, we ran two separate surveys; For the first, we surveyed people from every US state and asked them to report their average daily screen time as it appears in their screen time app. We used the average daily screen time to calculate the average weekly and annual screen time in minutes, hours, and days. Additionally, we compared the average daily screen time with the previously calculated data from 2019 to calculate the percentage increase or decrease in screen time. Only states with at least 25 responses are included in the analysis, so SD and WY are omitted. Across all states 2,603 total survey responses were collected. All responses were collected between April 20th and May 5th of 2021.
For the second survey, we asked 506 Americans about their screen time habits and opinions. The survey ran from April 21st to April 22nd of 2021. All survey data presented above relies on self-reporting.
Drew Wilkinson
Drew Wilkinson is the Head of Marketing at SimpleTexting. Drew has more than a decade of experience managing successful integrated marketing programs to build brands, raise awareness, and generate demand.
Start a text marketing campaign or have a 1-on-1 conversation today. It's risk free. Sign up for a free 14-day trial today to see SimpleTexting in action.
Hey! Looks like you're browsing from outside of North America.
Just so you know, SimpleTexting helps businesses in US & Canada only. If you are looking to send internationally or are based elsewhere in the world, you will love our sister product Sinch Engage.