Gen Z vs. Millennials: How they prefer to be messaged by brands
We surveyed over 1,400 U.S. Gen Z and Millennials to learn about their texting preferences and behaviors: including how they text day to day, and what makes them opt in, click, buy, or unsubscribe from brand SMS.
Brand texting is now widely accepted, but it is also tightly regulated by consumer attention.
To better understand how Americans feel about receiving texts from businesses, we surveyed over 1,400 consumers about their texting habits and brand communication preferences. Of those surveyed, 754 were Millennials and 673 were Gen Z, which allowed us to compare where these generations align and where they diverge.
Two big themes emerged, among many:
For one: consumers are open to texting, but they are strict about volume.
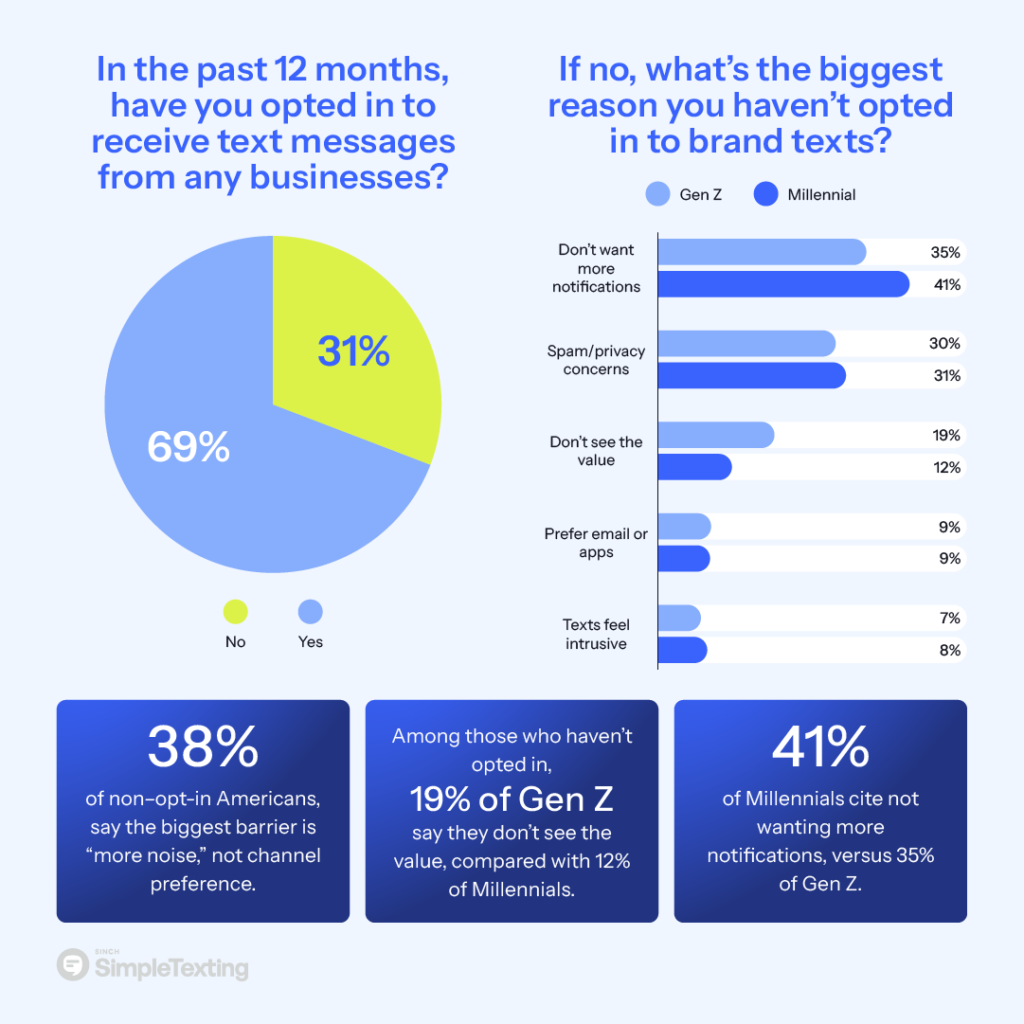
69% of Americans say they opted in to receive texts from at least one business in the last 12 months. At the same time, 90% say they want brand texts once per week or less.
Secondly, your brand texts have to compete with the entire phone experience.
85% of adults say they receive 10 or more notifications per day, and 50% receive 26 or more. You’re not just competing with other brands.
So what actually works with Gen Z and Millennials, and where are they more similar than different? Here’s a deeper look at what the survey data says.
Key takeaways for marketers and businesses
Opt-in is mainstream, but frequency anxiety is real. 69% opted in, and the top opt-in question is “How often will you text me?”
Weekly or less is the rule. 90% prefer brand texts once per week or less, led by “every other week” (40%).
Transactional wins trust. Order and shipping updates (73%) and appointment reminders (56%) outperform relationship messages by a wide margin.
Engagement is selective, but revenue is real. 59% rarely or never click links, yet 42% purchased due to a brand text in the past year.
Plain SMS beats rich formats. 49% say standard SMS is the type they are most likely to engage with.
AI introduces skepticism and requires transparency. 37% feel negative toward AI in SMS, and 72% want disclosure of it in some form.
Messaging habits: how consumers communicate in real life
Consumers do not experience brand messages in isolation. Their personal messaging habits set the baseline for what feels normal, what feels pushy, and what feels worth opening.
In our survey, 31% of Americans send more than 25 personal texts per day, while 40% send fewer than 10. Gen Z texts more often than Millennials, but the gap is not huge:
Gen Z: 35% send 25 or more texts per day
Millennials: 28% send 25 or more texts per day
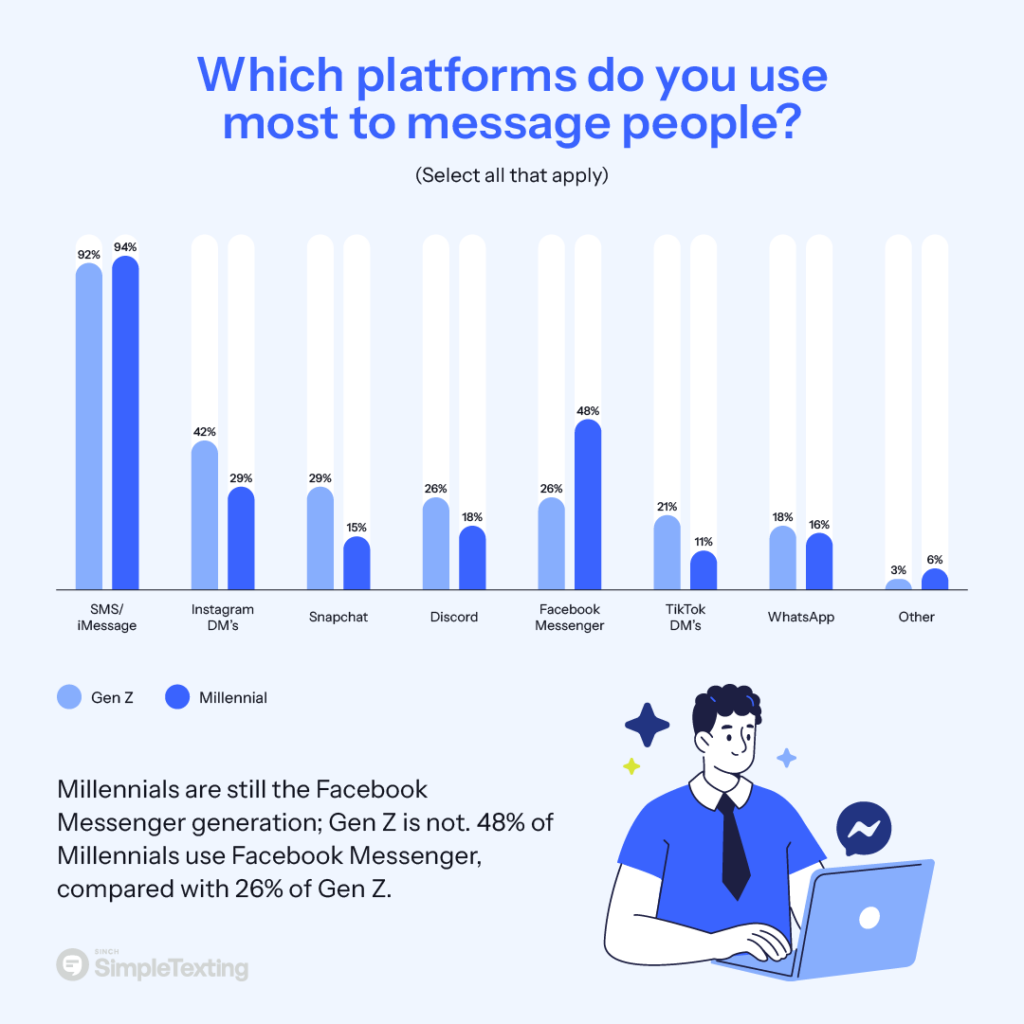
Which messaging platforms do consumers use most?
SMS and iMessage dominate everyday communication. 93% of Americans say they use SMS or iMessage the most when messaging other people.
After texting, messaging splits across social apps: Facebook Messenger (38%), Instagram DMs (35%), Discord (22%), Snapchat (21%), WhatsApp (17%), and TikTok DMs (16%).
Key generational differences:
Millennials over-index on Facebook Messenger (48% Millennials vs. 26% Gen Z)
Gen Z over-index on Instagram DMs (42% vs. 29%), Snapchat (29% vs. 15%), TikTok DMs (21% vs. 11%), and Discord (26% vs. 18%)
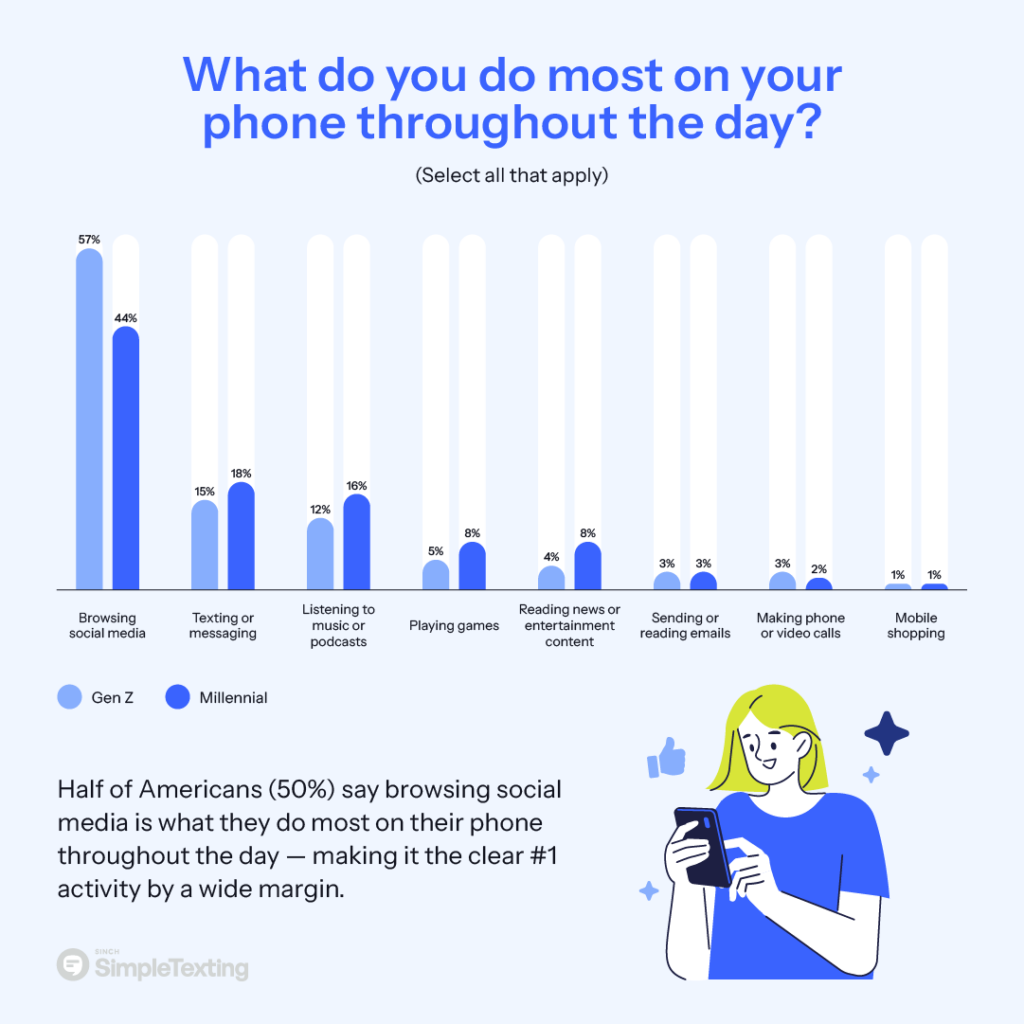
What do consumers do most on their phones?
When consumers choose the single activity they do most on their phones, browsing social media leads at 50%. Texting and messaging come next at 17%, followed by listening to music or podcasts at 14%.
Email (3%), calls (3%), and mobile shopping (1%) barely register as the top activity.
Generational differences:
Gen Z is more social-first (57% vs. 44% Millennials)
Millennials are more likely to choose music or podcasts (16% vs. 12%), news or entertainment (8% vs. 4%), games (8% vs. 5%), or texting and messaging (18% vs. 15%)
How often do consumers use emojis, GIFs, and stickers in personal texts?
Emojis, GIFs, and stickers are nearly universal: 88% use them at least sometimes.
54% use them in about half of their messages
16% use them in most messages
Only 2% say they never use them
Gen Z is slightly more likely to use them heavily (18% vs. 14%), but both generations clearly communicate in a casual, expressive style.
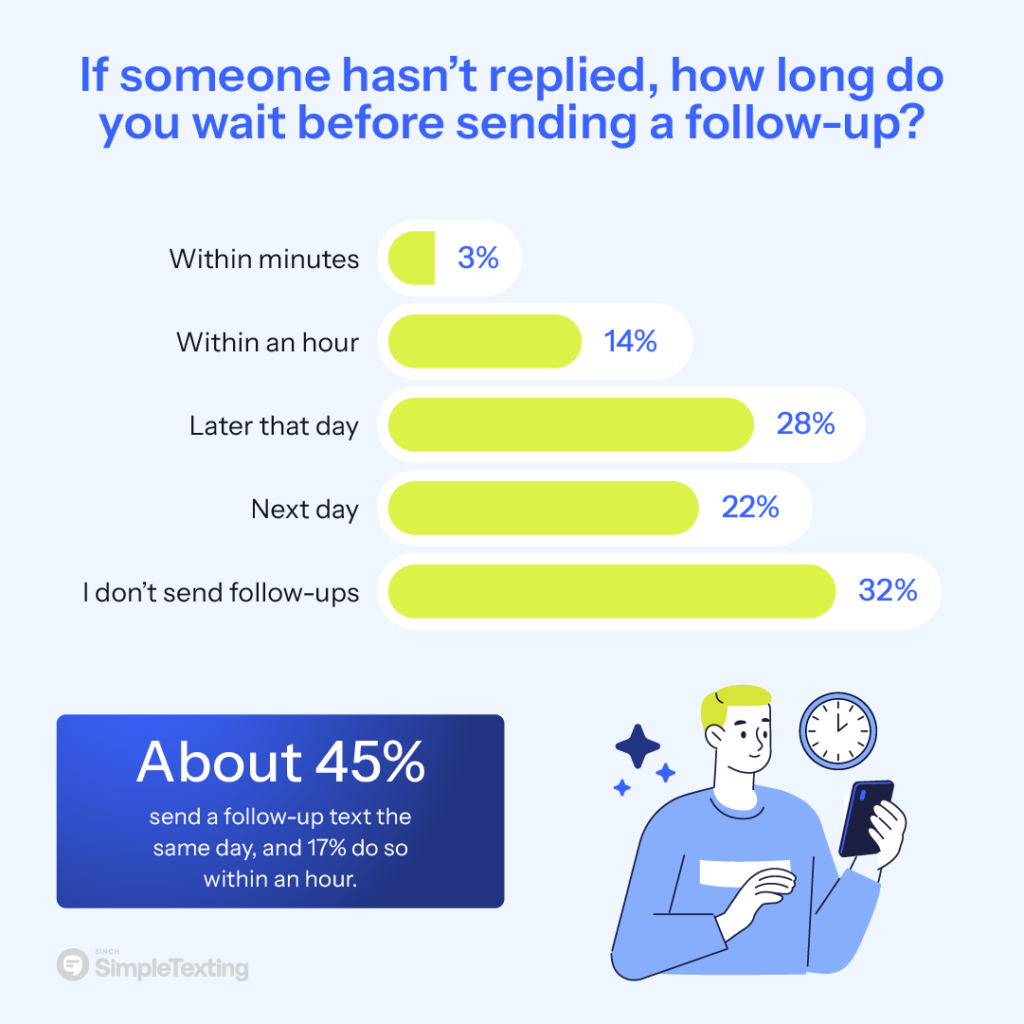
How quickly do consumers follow up when someone has not replied?
Most Americans do not follow up quickly. 55% either wait until the next day (22%) or do not follow up at all (32%). Still, follow-ups are common: 45% send a follow-up the same day, and 17% do it within an hour.
Gen Z is slightly more comfortable sending follow-ups at least sometimes (70% vs. 66%).
What this means for brands: Consumers are used to fast visibility, but not constant back-and-forth. SMS works best when it is low-friction and high-value.
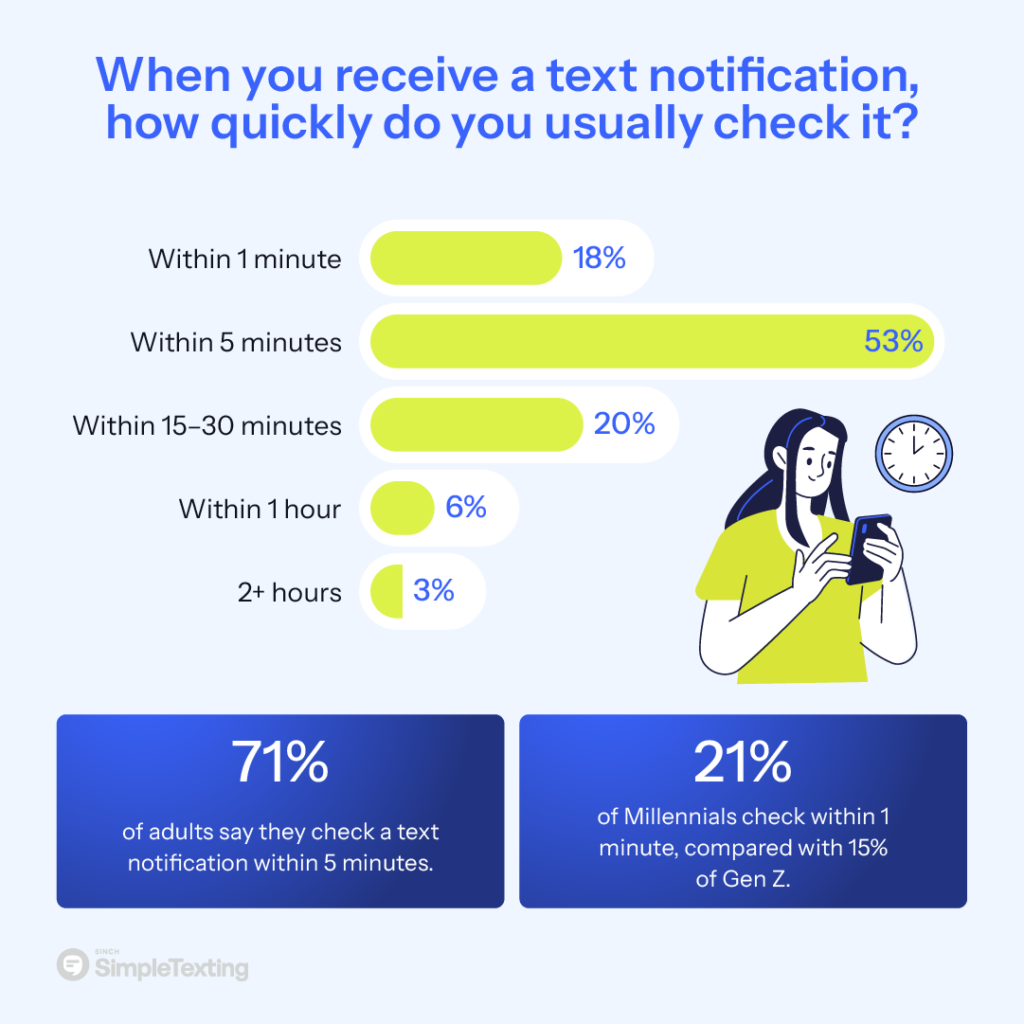
How quickly do consumers see texts, and how overloaded are they?
How quickly do consumers check a text notification?
Texts are seen quickly: 71% check a text notification within five minutes, including 18% within 60 seconds. In total:
92% check within 30 minutes
97% check within an hour
Only 3% typically wait two or more hours
Generationally, Millennials are more likely to check within one minute (21% vs. 15%), while Gen Z is slightly more likely to wait 15 minutes or longer (31% vs. 27%).
Do consumers set quiet hours or Do Not Disturb for messaging?
Attention protection is mainstream: 52% set quiet hours or Do Not Disturb at least sometimes (29% sometimes, 23% every day). Gen Z uses these settings more (58% vs. 47%).
How many notifications do consumers receive per day?
Notification overload is the baseline: 85% receive 10 or more notifications per day.
About 50% receive 26 or more per day
23% receive 51 or more
8% receive 100 or more
Gen Z is slightly more likely to fall into the 26-plus tier (53% vs. 48%).
What this means for brands: If texts are fast to be seen, they are also fast to be judged. In an overloaded environment, frequent mistakes get punished quickly.
Are consumers opting into brand texts, and what stops them?
Opting in is mainstream. 69% opted in to receive texts from a business in the past 12 months. Gen Z and Millennials are nearly identical (68% vs. 70%), suggesting a list growth opportunity exists across both cohorts.
For people who have not opted in, the biggest blockers are about noise and trust:
38% do not want more notifications
30% say spam or privacy concerns
16% do not see the value
9% prefer email or apps
8% feel texts are intrusive
Gen Z non-opt-ins are more likely to say they do not see the value (19% vs. 12%). Millennials’ non-opt-ins are more likely to cite notification overload (41% vs. 35%).
What is the biggest factor consumers consider before opting in?
Before opting in, the number one question is frequency. 28% say the biggest factor they consider is “How often will you text me?”
After frequency, the next most common decision drivers are exclusive deals (23%) and fear of being spammed (20%). Those top three account for 71% of responses.
Generational notes:
Millennials are slightly more frequency sensitive (30% vs. 26%)
Gen Z is slightly more focused on spam and trust (spam: 22% vs. 19%; trust: 11% vs. 8%)
Which industries are consumers most likely to opt in to for texts?
Industry matters. Nearly half (48%) are most likely to opt in to texts from ecommerce and retail brands, followed by healthcare (43%).
After that, interest drops to a second tier: travel (24%), consumer services (23%), finance (20%), and technology (20%). Construction and manufacturing are lowest at 3% each.
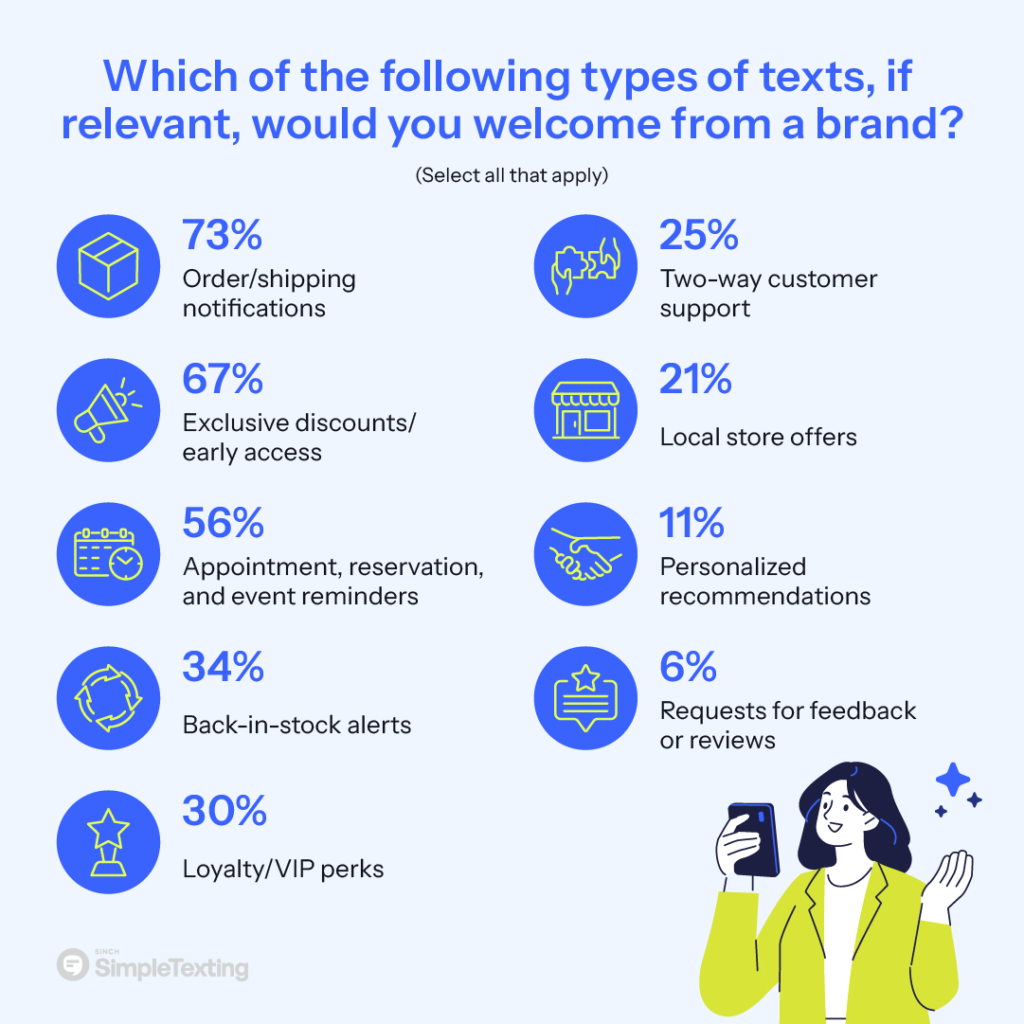
What kinds of brand texts do consumers actually want?
Consumers welcome texts that are practical or high value:
Order and shipping notifications (73%)
Exclusive discounts or early access (67%)
Appointment or reservation reminders (56%)
Interest drops sharply after those categories. Only 11% welcome personalized recommendations, and only 6% want requests for feedback or reviews.
Millennials are more receptive than Gen Z to service and relationship-oriented texts, including two-way customer support (27% vs. 22%), loyalty or VIP perks (32% vs. 27%), and local store offers (22% vs. 19%).
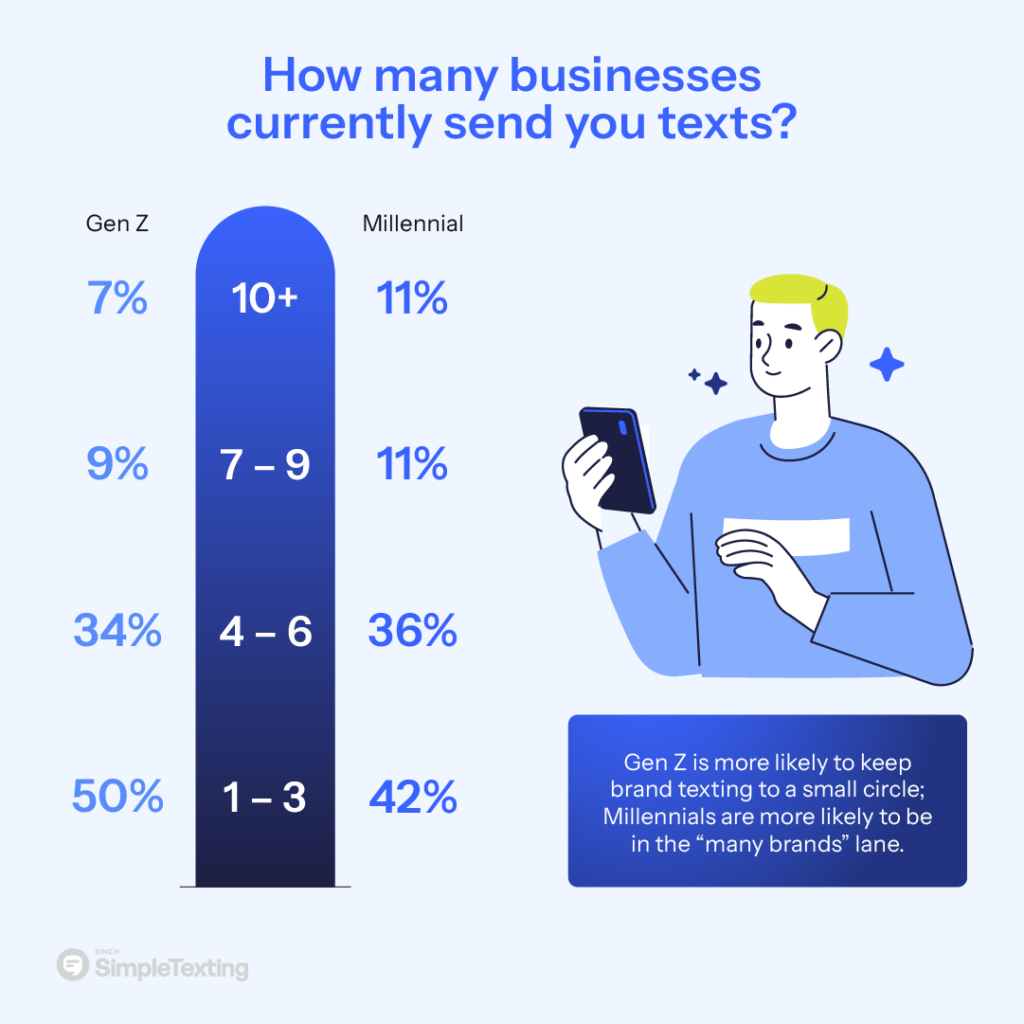
How many businesses currently text the average consumer?
Brand texting is usually limited to a small group:
46%: one to three businesses
35%: four to six
19%: seven or more (including 9% who report 10 businesses)
Gen Z is more likely to keep brand texting limited to one to three businesses (50% vs. 42%) and less likely to be in the seven-plus bucket (16% vs. 22%).
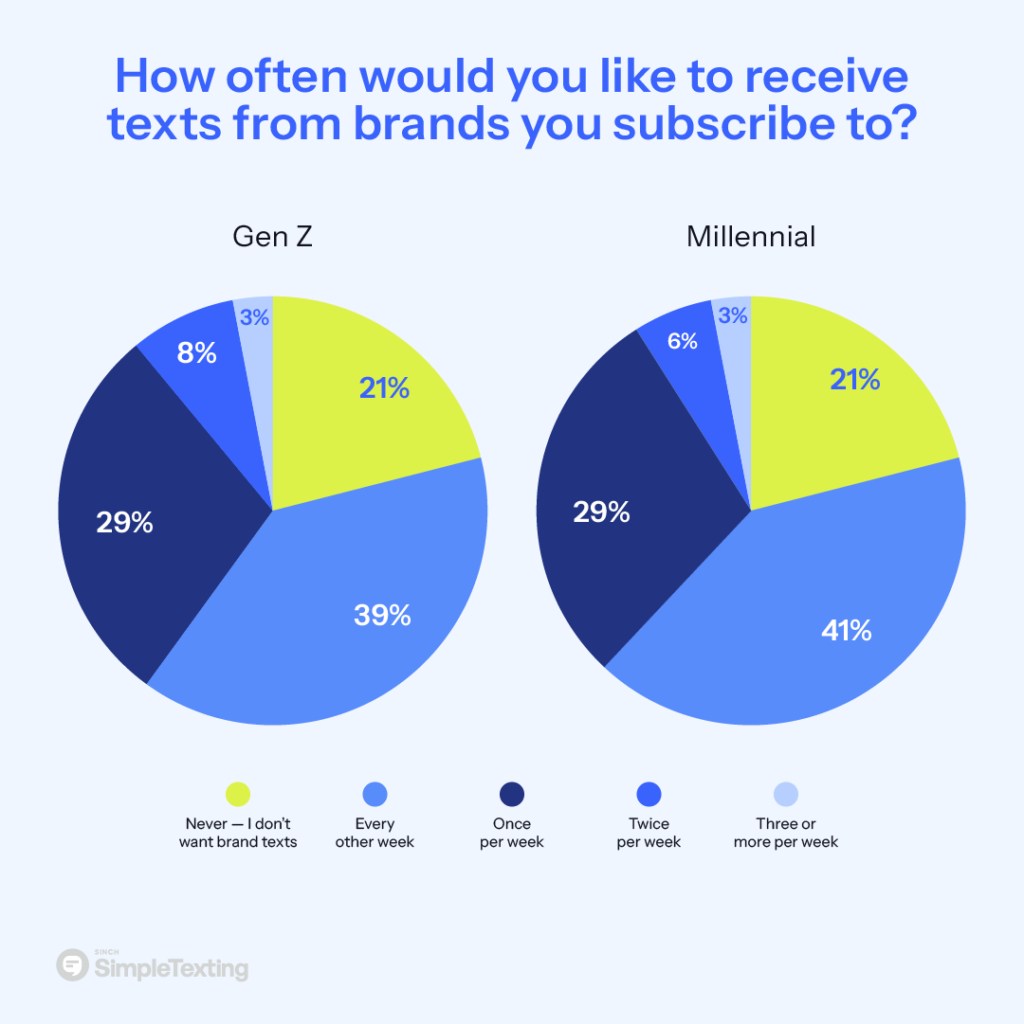
How often and when do consumers want brands to text?
Most Americans want a light cadence. 90% prefer brand texts once per week or less.
Every other week (40%)
Once per week (29%)
Only 10% want two or more texts per week
Both generations land in essentially the same place. About 89% to 91% want one text per week or less, and about 21% in each group say they do not want brand texts at all. Gen Z is slightly more open to higher frequency messaging (12% vs. 9%).
When it comes to timing, the afternoon is the sweet spot. 42% say the best time for a brand to text them is 12 to 5pm. Another 28% have no preference. Among those who have a preference, afternoon accounts for about 58% of stated preferences.
Millennials lean more toward afternoon texting (44% vs. 40%). Gen Z is slightly more open to morning texts from 8 to 11am (13% vs. 11%).
What makes consumers tune out brand texts?
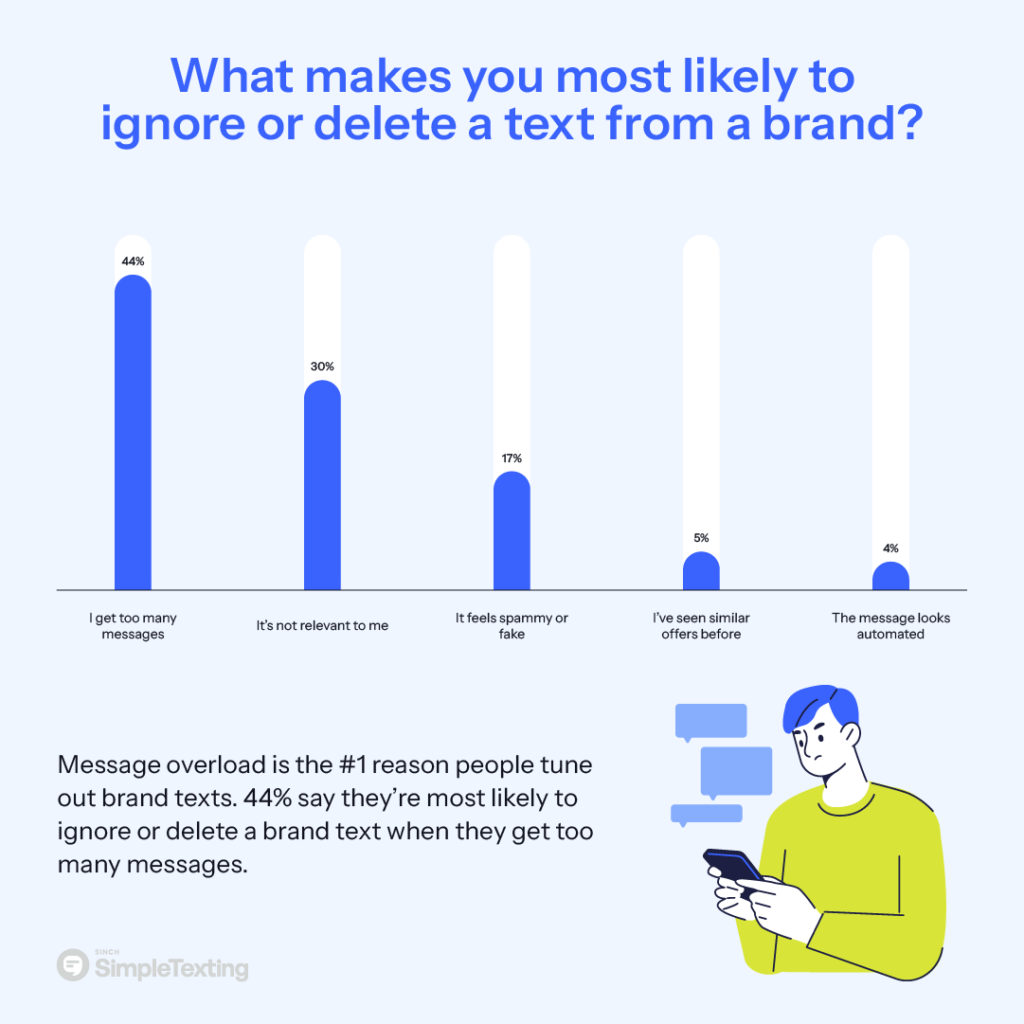
Message overload is the top reason consumers tune out. 44% say they are most likely to ignore or delete a brand text when they get too many messages, and it is the number one response by a wide margin.
Relevance is the next big driver. 30% ignore or delete texts when the message is not relevant, while 17% cite messages that feel spammy or fake. Far fewer blame creative fatigue (5% say “seen similar offers”) or automation cues (4% say “it looks automated”) as their primary reason.
Gen Z is slightly more sensitive to volume (46% Gen Z vs. 42% Millennials). Millennials are slightly more sensitive to trust cues (18% Millennials vs. 15% Gen Z for “feels spammy or fake”).
How do consumers engage with brand texts, and does SMS drive purchases?
Most consumers click selectively:
59% rarely or never click links (39% rarely, 21% never)
34% sometimes
7% often or always (6% often, 1% always)
Millennials are more likely to click at least sometimes (44% vs. 38%).
How often do consumers reply to brand texts like polls and questions?
Replies are harder than clicks:
49% never reply
31% rarely
18% sometimes
About 2% reply often
In total, 80% reply rarely or never, which makes SMS polling a high-friction tactic for most consumers.
Have consumers made purchases because of brand texts in the past 12 months?
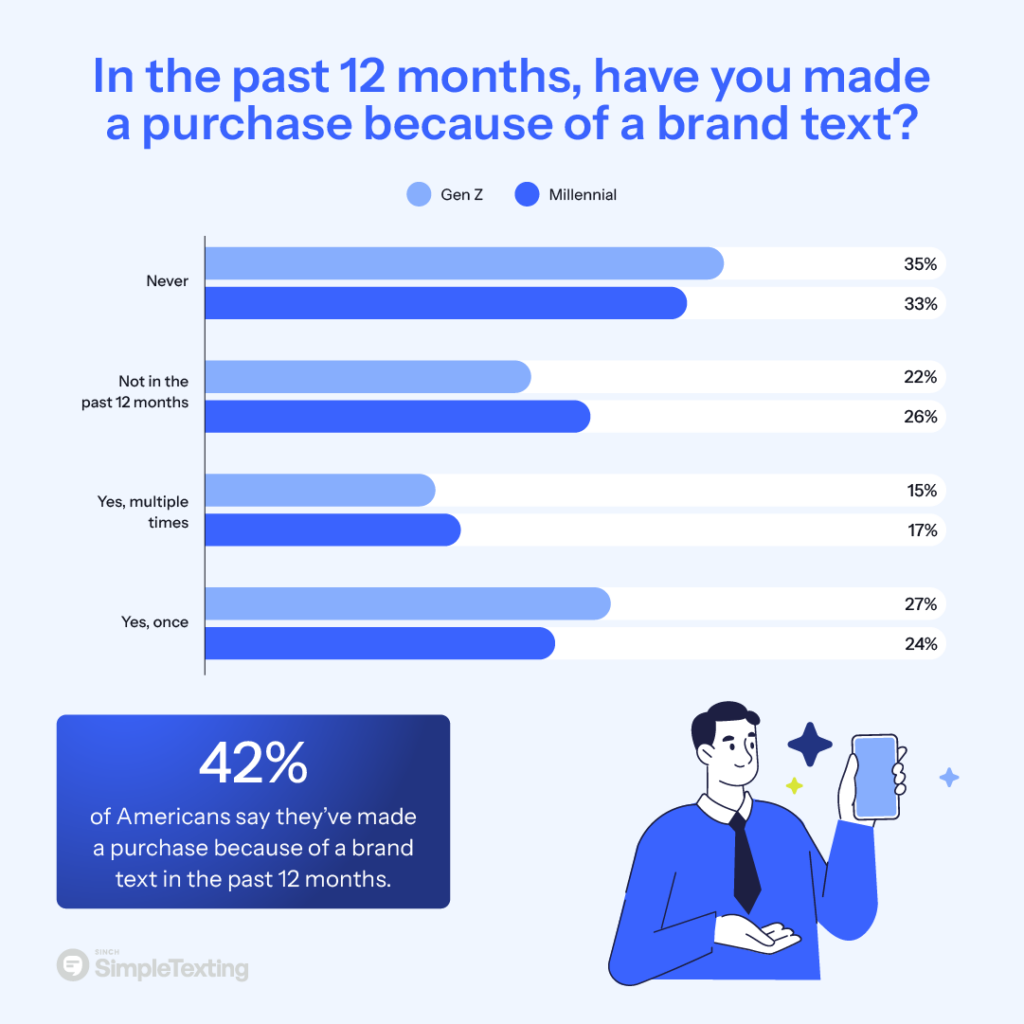
SMS influences real buying behavior. 42% made a purchase because of a brand text in the past 12 months (16% multiple times, 25% once).
At the same time, 58% have not purchased from a brand text in the past year (34% never, 24% not in the past 12 months). Looking beyond the last year, 66% say a brand text has influenced a purchase at some point.
Gen Z is more likely to be a one-time converter in the past year (27% vs. 24%). Millennials are slightly more likely to be repeat converters (17% vs. 15%).
Which type of brand text format do consumers engage with most?
Plain text still wins:
Standard SMS (49%)
MMS (9%)
RCS (6%)
Do not engage with brand texts at all (19%)
No preference (17%)
Gen Z is more SMS-first (52% vs. 47%). Millennials are more open to enhanced formats like MMS (10% vs. 7%) and RCS (7% vs. 6%).
How does personalization affect engagement, and what data will consumers share?
The most compelling personalization is discounts tied to demonstrated interest. 63% are more likely to engage with discounts on items they browsed or liked.
A second tier includes product updates on items of interest (29%) and localized offers or events (26%). Personalization is not a universal win:
19% select “none of the above”
Only 9% prefer messages timed to when they usually shop
Gen Z is slightly more responsive to timing personalization (11% vs. 8%). Millennials are slightly more likely to opt out of personalization altogether (21% vs. 16%).
What personal details are consumers willing to share for more relevant messages?
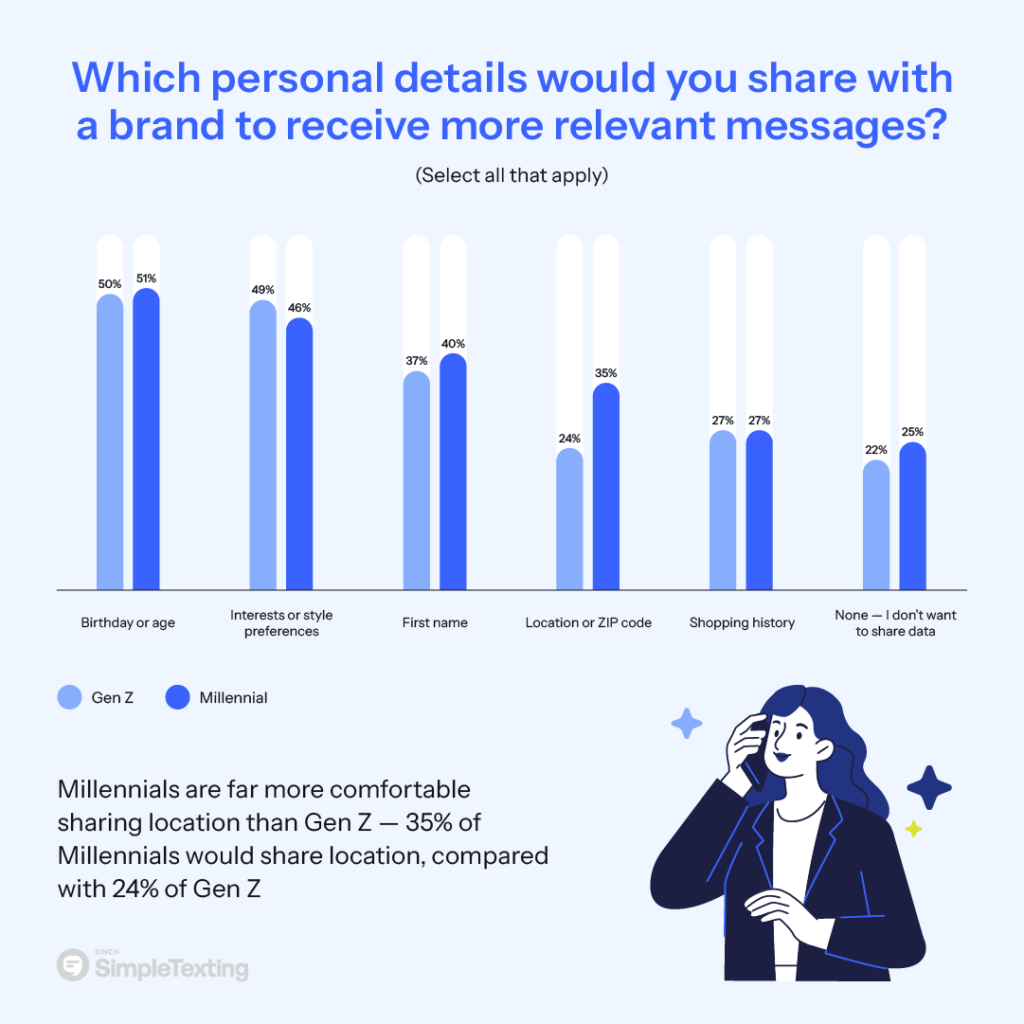
Consumers will share some information, but not everything:
Birthday or age (50%)
Interests or style preferences (47%)
First name (38%)
Location or ZIP (30%)
Shopping history (27%)
None (23%)
Millennials are more comfortable sharing location than Gen Z (35% vs. 24%).
Which channels do consumers prefer for different types of brand messages?
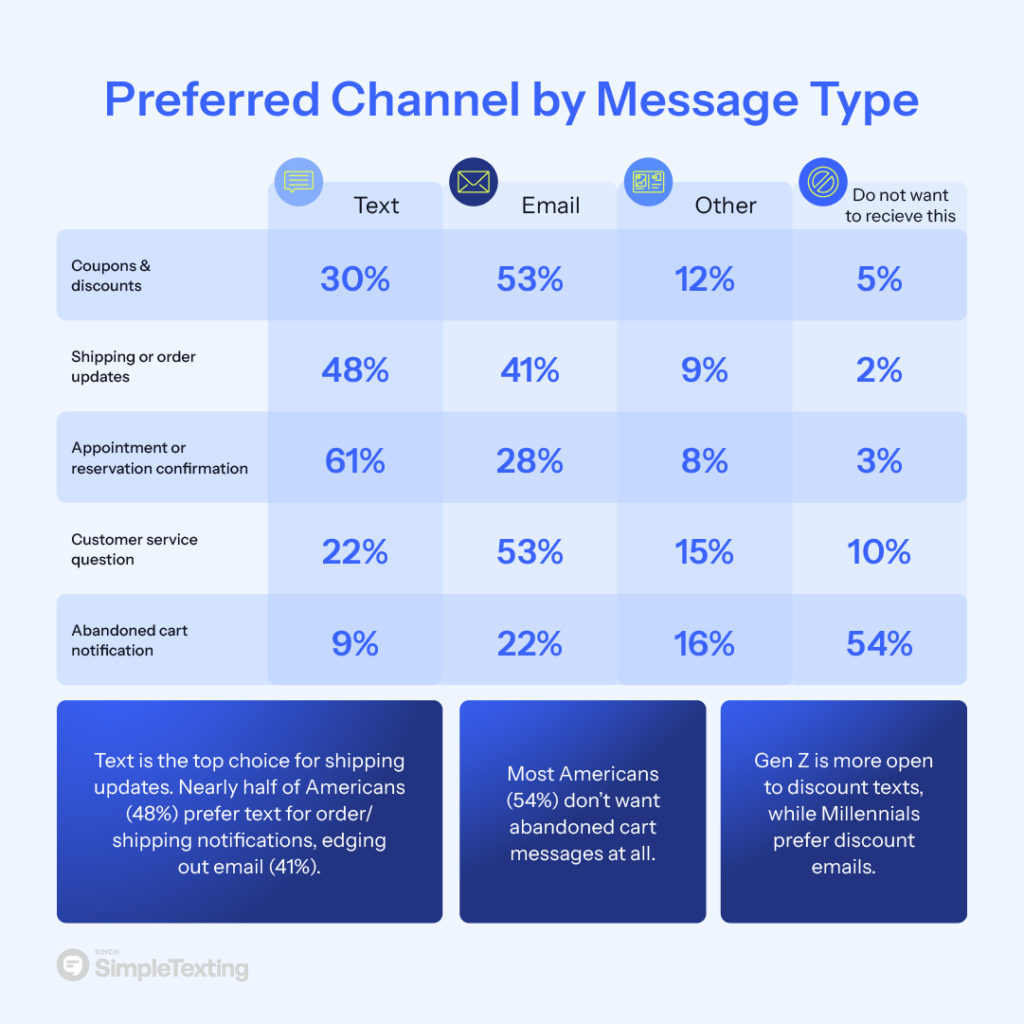
Channel preference depends heavily on the message.
Coupons and discounts: Email remains the default.
53% prefer email for deals
30% prefer text
Gen Z is more open to discounts via text (33% vs. 27%), while Millennials are more email-first (57% vs. 48%).
Shipping or order updates: Text takes the lead.
48% prefer text
41% prefer email
Both generations agree that texting fits best.
Appointment or reservation confirmations: Texting is the clear winner.
61% prefer text
28% prefer email
Millennials are even more text-first for confirmations (63% vs. 58%).
Customer service questions: Email leads.
53% prefer email
22% prefer text
About 10% do not want customer service questions from brands at all.
Abandoned cart notifications: Most consumers do not want them.
54% select “do not want to receive this.”
Among those open to it: email (22%), app notifications (13%), and text (9%).
How do consumers feel about AI in brand texts, and what tone drives engagement?
How do consumers feel about brands using AI, and do they want disclosure?
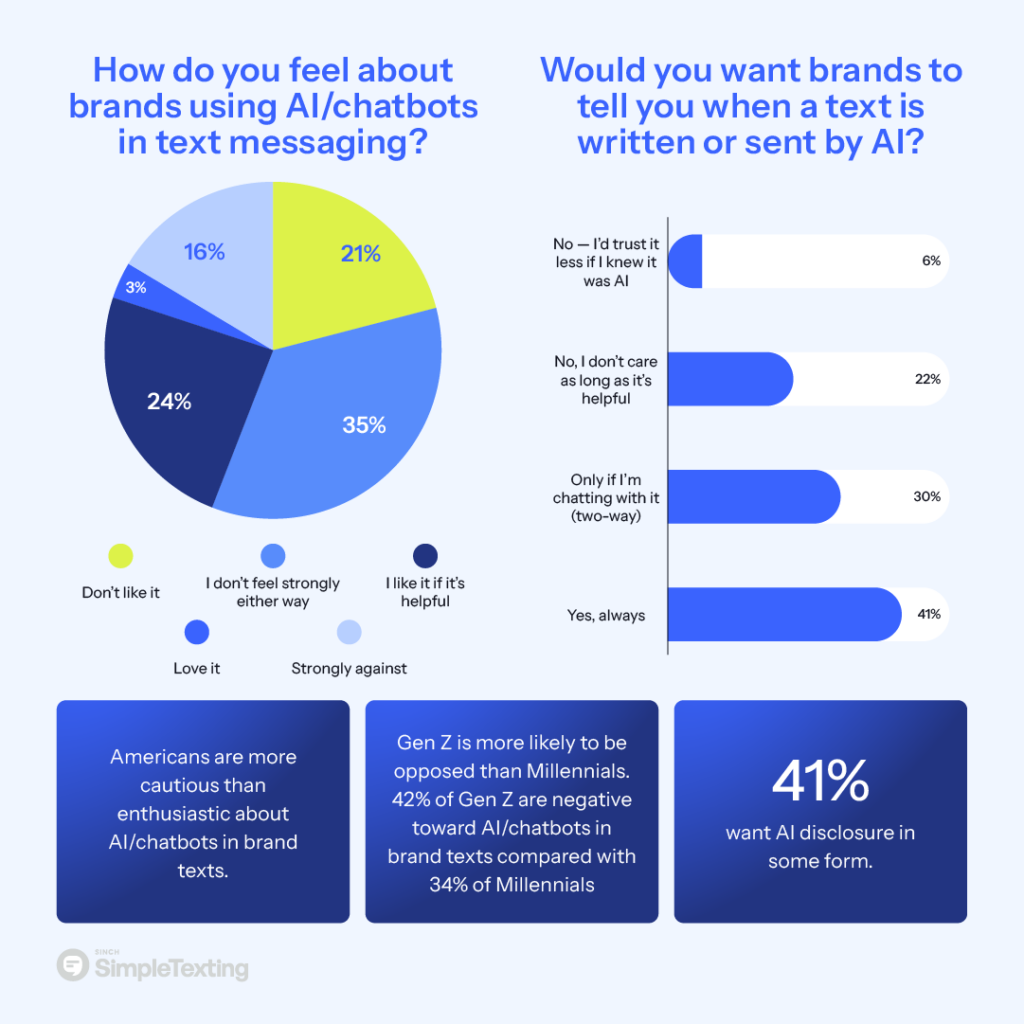
Consumers are more cautious than enthusiastic about AI in brand texts:
37% feel negative
27% feel positive
35% do not feel strongly either way
Gen Z is more likely to be opposed (42% negative vs. 34%). Millennials are more likely to be indifferent (39% vs. 31%).
When it comes to transparency, consumers want disclosure:
41% say brands should always disclose when a text is written or sent by AI
30% say disclosure is needed at least when it is a two-way chat Together, 72% want disclosure in some form.
Do consumers think businesses that text provide a better customer experience?
Americans are largely unconvinced that texting automatically equals a better customer experience. Nearly half (48%) take a neutral stance. The rest split evenly (26% agree overall, 26% disagree overall).
Do consumers feel more connected to brands that text them than those that email them?
Texting does not automatically build connections, either. 43% disagree that they feel more connected to brands that text (28% disagree, 15% strongly disagree), while 25% agree (20% agree, 5% strongly agree). Another 32% say neither.
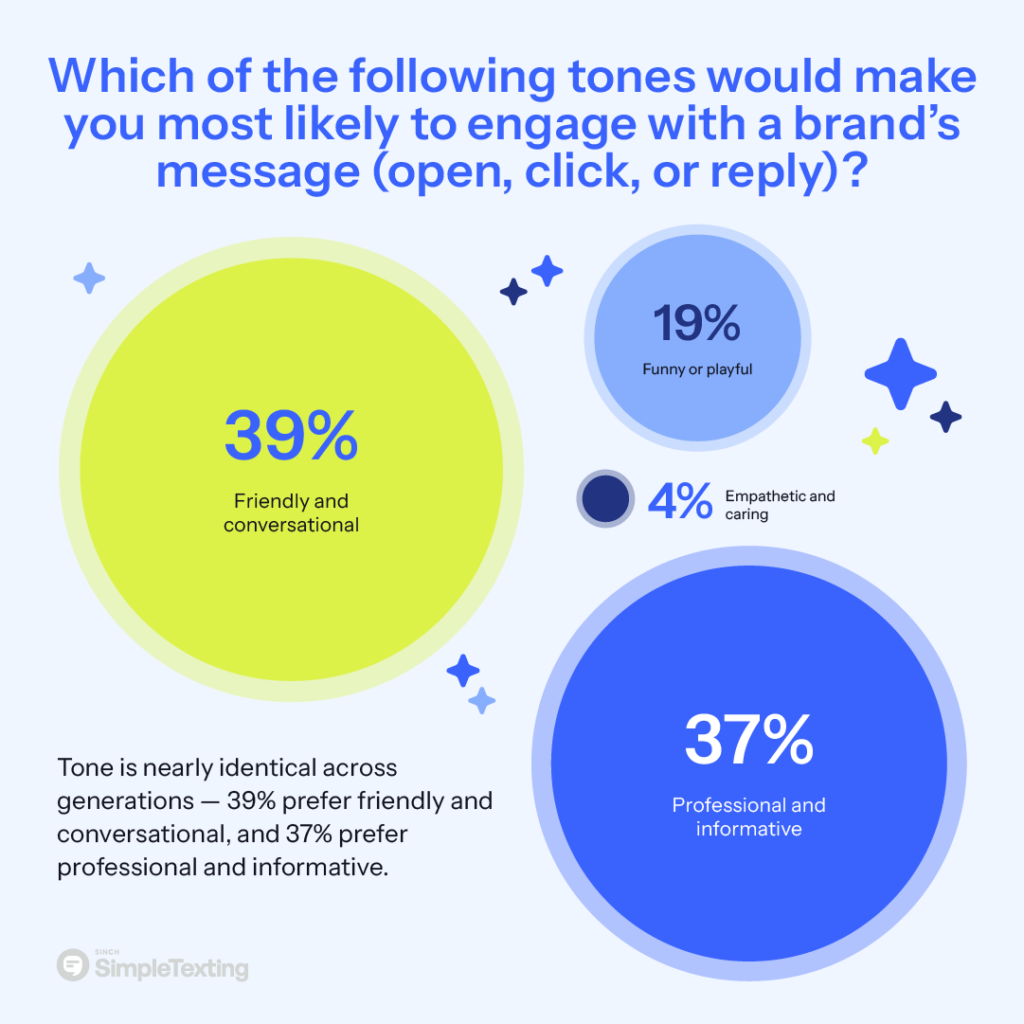
Which tones make consumers most likely to engage with brand messages?
Consumers respond most to two tones:
Friendly and conversational (39%)
Professional and informative (37%)
Humor has an audience, but it is secondary:
Funny or playful (19%)
Empathetic and caring (4%)
Gen Z and Millennials are remarkably aligned on tone. Friendly and conversational sits at 40% Gen Z vs. 39% Millennials, professional and informative is 37% for both, and funny or playful is 19% for both.
The future of brand messaging for Gen Z and Millennials
Gen Z and Millennials are more similar than many brands assume. Both groups opt in at nearly the same rate, both expect a light cadence, and both prefer messaging that feels either friendly or straightforward.
The opportunity is not to send more texts. It is sending fewer, better texts.
Consumers welcome updates, confirmations, and real value. They ignore messages that feel excessive, irrelevant, or spammy. They also want transparency when automation enters the conversation.
If there is one rule that shows up across the entire report, it is this: permission gets you in the door, but relevance is what keeps you there.
Methodology
The statistics in this report come from a survey conducted by SimpleTexting of 1,427 Americans between December 3, 2025, and December 11, 2025. Among those surveyed, 754 were Millennials and 673 were Gen Z, answering the same set of 29 questions about their texting habits and how they prefer to be messaged by brands.
Fair Use
You are welcome to use, reference, and share non-commercial excerpts of this study with proper attribution. If you cite or cover our findings, please link back to this page so readers can view the full methodology, charts, and context.
69% of Americans opted in to receive texts from at least one business in the last 12 months — nearly identical across generations (70% Millennials, 68% Gen Z). Most consumers limit brand texting to a small group: 46% receive texts from just 1–3 businesses. The most popular industries for opt-in are e-commerce/retail (48%) and healthcare (43%).
The top blockers are not wanting more notifications (38%), spam or privacy concerns (30%), and not seeing the value (16%). The single biggest question consumers want answered before opting in is “How often will you text me?” (28%), followed by access to exclusive deals (23%) and fear of spam (20%). Millennials are more worried about notification overload (41% vs. 35%); Gen Z is more likely to say they don’t see the value (19% vs. 12%).
90% want brand texts once per week or less. The most preferred cadence is every other week (40%), followed by once per week (29%). Only 10% are open to two or more texts per week. Both generations align closely here — about 21% in each group say they don’t want brand texts at all.
42% say the best time is 12–5 PM. Among those with a stated preference, afternoon accounts for about 58% of responses. Millennials lean slightly more toward afternoons (44% vs. 40%); Gen Z is marginally more open to morning texts between 8–11 AM (13% vs. 11%).
The most welcomed messages are transactional and high-value: order and shipping updates (73%), exclusive discounts or early access (67%), and appointment or reservation reminders (56%). Interest drops sharply after those three — only 11% welcome personalized product recommendations and just 6% want feedback or review requests. Millennials are more receptive to loyalty/VIP perks (32% vs. 27%) and two-way customer support (27% vs. 22%).
The top reason by a wide margin is receiving too many messages (44%). Irrelevance is next (30%), followed by messages that feel spammy or fake (17%). Creative fatigue (5%) and obvious automation cues (4%) are minor factors. Gen Z is slightly more sensitive to volume (46% vs. 42%); Millennials are slightly more sensitive to trust cues (18% vs. 15%).
59% rarely or never click links in brand texts (39% rarely, 21% never). Replies are even harder — 80% rarely or never respond to polls or questions, and 49% never reply at all. Millennials are more likely to click at least sometimes (44% vs. 38%).
Yes. 42% made a purchase because of a brand text in the last 12 months (16% multiple times, 25% once), and 66% say a brand text has influenced a purchase at some point. Low click rates don’t tell the whole revenue story. Gen Z is more likely to be one-time converters (27% vs. 24%); Millennials are slightly more likely to be repeat purchasers (17% vs. 15%).
Standard SMS leads (49%), far ahead of MMS (9%) and RCS (6%). 19% say they don’t engage with brand texts at all. Gen Z is even more SMS-first (52% vs. 47%).
Discounts tied to items a consumer browsed or liked are by far the most compelling (63%). Product updates on items of interest come next (29%). Timing personalization resonates with only 9%. 19% want no personalization at all. In terms of data consumers will share: birthday/age (50%), interests or style preferences (47%), and first name (38%) top the list — only 30% will share location, and 23% will share nothing.
Google is rolling out a feature that allows you to display your logo, business name, and URL previews in your texts to Android users. Here’s what you need to know about it.
Start a text marketing campaign or have a 1-on-1 conversation today. It's risk free. Sign up for a free 14-day trial today to see SimpleTexting in action.
Hey! Looks like you're browsing from outside of North America.
Just so you know, SimpleTexting helps businesses in US & Canada only. If you are looking to send internationally or are based elsewhere in the world, you will love our sister product Sinch Engage.